Exercise Set #1
Contents
Exercise Set #1
FIZ228 - Numerical Analysis
Dr. Emre S. Tasci, Hacettepe University
1
Import the meteorological data (01_meteoblue_Basel_20230303T060433.csv) as a pandas dataframe (if you can’t readily access the course webpage, you can also download it from the meteoblue site with the date range being 1/1/2022 - 3/3/2023 and the parameters set to those you’ll need for this example ;).
Then:
Calculate the average daily temperature on February, 5th, 2022
Find the most cloudy day in January 2022
Find the most cloudy hour in January 2022
Find the most sunny day, calculate the total radiation energy received in 2002
2
Draw 1000 samples from a Gaussian (normal) distribution with \(\mu = 10\), \(\sigma = 1.2\)
Calculate the mean and standard deviation of the samples.
Plot its histogram for 10 bins (you can use either matplotlib.pyplot or seaborn).
Hint: You can have the bin positions defined as the average of the left and right boundary of each bin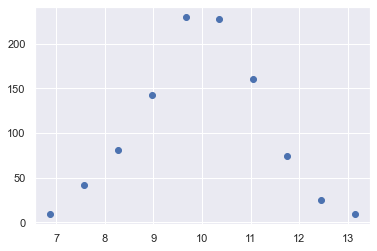
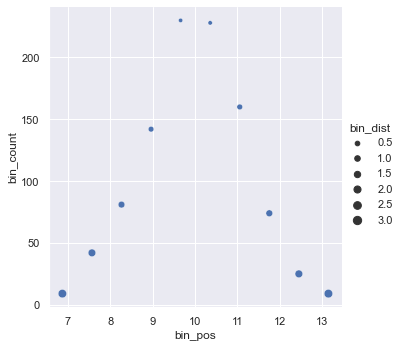
Define a pandas dataframe such that it has three columns:
bin_pos: bin positionbin_count: count of the samples per each binbin_dist: its distance to the mean
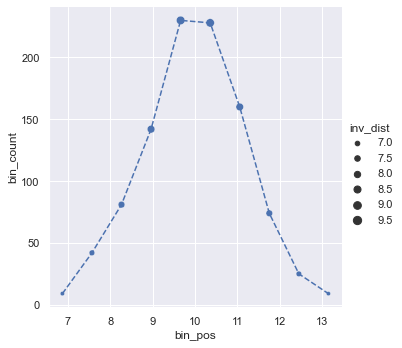
Using seaborn, plot the dataframe data such that the horizontal axis is the bin_pos, the vertical axis is the bin_count and the points’ sizes change with respect to bin_dist.
Challenge: try to modify the graph such that the points closer to the mean are displayed bigger in size, while the dots are connected by a line