Midterm Exam #2 (20232) Written Session
Midterm Exam #2 (20232) Written Session
FIZ228 - Numerical Analysis
Dr. Emre S. Tasci, Hacettepe University
17/05/2024
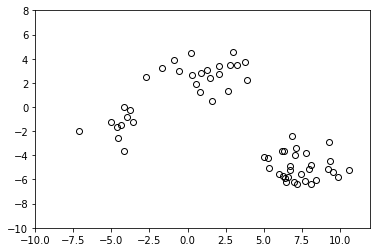
Consider the data plotted in the figure below. We want to classify these data points into three classes using k‑means clustering method.
a) Mark the approximate expected positions of the means on the figure. Use the symbols “■”, “▲” and “✖” to indicate the locations of the means, respectively.
b) Indicate the domains of each domain on the figure. (Imagine being given a random point, after the means are fixed with respect to the previously existing data (which you did in the previous part) – to which mean would you assign this given point? Once you do the assignment, it means that, that position is within the domain of that mean. Now consider all the positions in the graph to define the domain of each mean and indicate these domains on the figure – that is what is being asked of you ;).
c) Derive a systematical algorithm to define the domains of each mean (writing a code is not necessary, also not desired, just define the procedures in steps so that a coder without any prior knowledge of the topic can implement it as a code).
d) One downside of this method is the fact that the resulting classification depends on the initial positions of the means. Suppose that for a different set (in which the classification might not be so obvious compared to the one above), you have run your code 20 times, coming up with 20 different associations, with the means’ final positions for each run also stored somewhere. How would you decide on the best classification?
Bonus: The data plotted have been generated using three 2D Gaussians. A Gaussian is defined through this equation:
Describe how you’d generate such data using the Gaussian function. (Try to justify parameters using numerical values with regard to the plotted data in the figure above.)